
NN is an abstract S3 superclass for the classes of the objects returned
by kNN(), frNN() and sNN(). Methods for sorting, plotting and getting an
adjacency list are defined.
Arguments
- x
a
NNobject- ...
further parameters past on to
plot().- decreasing
sort in decreasing order?
- data
that was used to create
x- main
title
- pch
plotting character.
- col
color used for the data points (nodes).
- linecol
color used for edges.
Examples
data(iris)
x <- iris[, -5]
# finding kNN directly in data (using a kd-tree)
nn <- kNN(x, k=5)
nn
#> k-nearest neighbors for 150 objects (k=5).
#> Distance metric: euclidean
#>
#> Available fields: dist, id, k, sort, metric
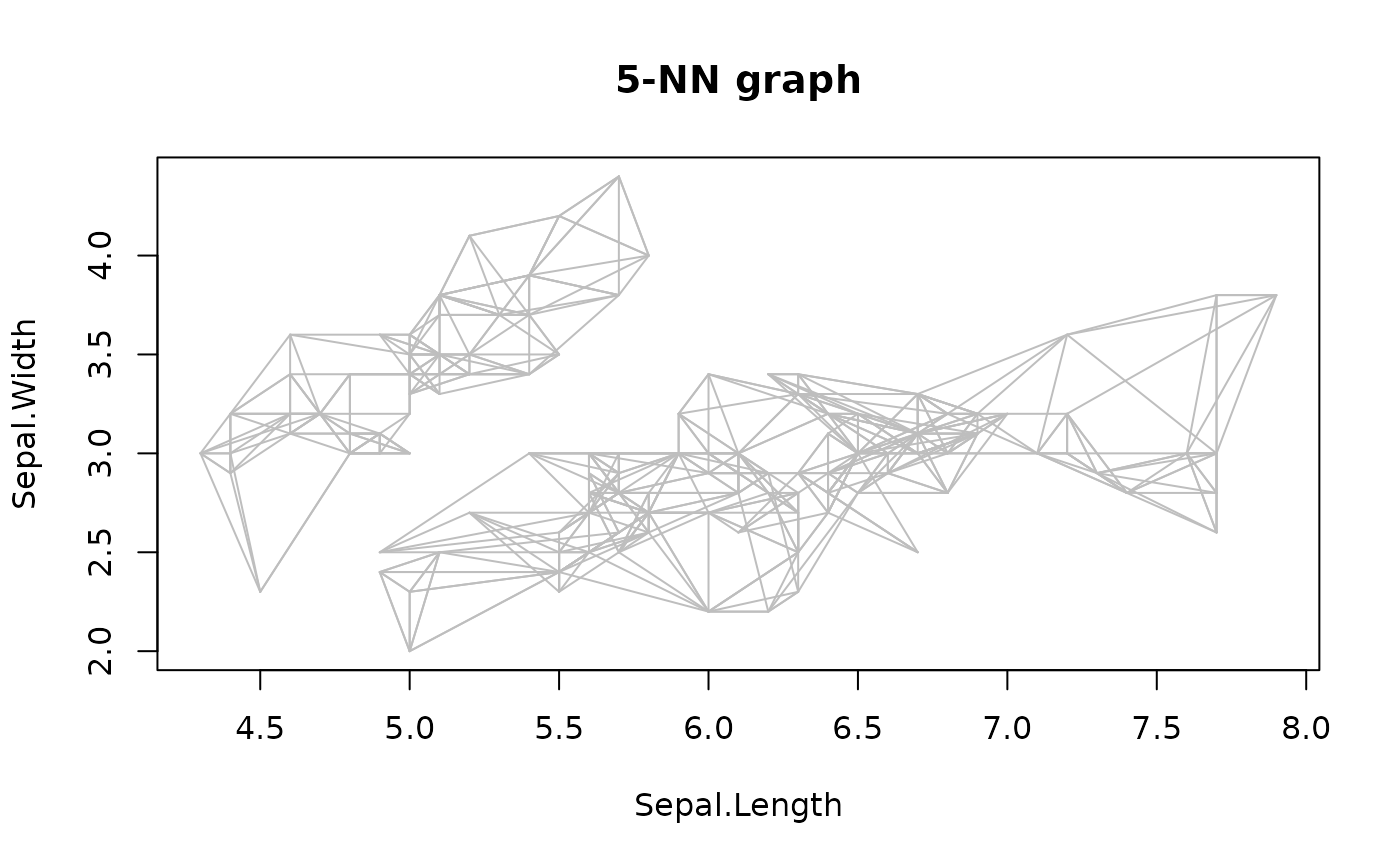
# plot the kNN where NN are shown as line conecting points.
plot(nn, x)
 # show the first few elements of the adjacency list
head(adjacencylist(nn))
#> [[1]]
#> 1 2 3 4 5
#> 18 5 40 29 28
#>
#> [[2]]
#> 1 2 3 4 5
#> 35 46 13 10 26
#>
#> [[3]]
#> 1 2 3 4 5
#> 48 4 7 13 46
#>
#> [[4]]
#> 1 2 3 4 5
#> 48 30 31 3 46
#>
#> [[5]]
#> 1 2 3 4 5
#> 38 1 18 41 8
#>
#> [[6]]
#> 1 2 3 4 5
#> 19 11 49 45 20
#>
if (FALSE) { # \dontrun{
# create a graph and find connected components (if igraph is installed)
library("igraph")
g <- graph_from_adj_list(adjacencylist(nn))
comp <- components(g)
plot(x, col = comp$membership)
# detect clusters (communities) with the label propagation algorithm
cl <- membership(cluster_label_prop(g))
plot(x, col = cl)
} # }
# show the first few elements of the adjacency list
head(adjacencylist(nn))
#> [[1]]
#> 1 2 3 4 5
#> 18 5 40 29 28
#>
#> [[2]]
#> 1 2 3 4 5
#> 35 46 13 10 26
#>
#> [[3]]
#> 1 2 3 4 5
#> 48 4 7 13 46
#>
#> [[4]]
#> 1 2 3 4 5
#> 48 30 31 3 46
#>
#> [[5]]
#> 1 2 3 4 5
#> 38 1 18 41 8
#>
#> [[6]]
#> 1 2 3 4 5
#> 19 11 49 45 20
#>
if (FALSE) { # \dontrun{
# create a graph and find connected components (if igraph is installed)
library("igraph")
g <- graph_from_adj_list(adjacencylist(nn))
comp <- components(g)
plot(x, col = comp$membership)
# detect clusters (communities) with the label propagation algorithm
cl <- membership(cluster_label_prop(g))
plot(x, col = cl)
} # }