The dbscan package provides tidy(),
augment(), and glance() methods for its
clustering algorithms, making them easy to use with tidyverse, ggplot2,
and tidymodels.
Load the packages and prepare the numeric variables from the iris data:
Get cluster statistics as a tibble:
tidy(db)
#> # A tibble: 4 × 3
#>   cluster  size noise
#>   <fct>   <int> <lgl>
#> 1 0          29 TRUE
#> 2 1          48 FALSE
#> 3 2          37 FALSE
#> 4 3          36 FALSE
The tidier augment() can be used to combine the
clustering with the dataset which is useful for visualization.
augment(db, x)
#> # A tibble: 150 × 6
#>    Sepal.Length Sepal.Width Petal.Length Petal.Width .cluster noise
#>           <dbl>       <dbl>        <dbl>       <dbl> <fct>    <lgl>
#>  1          5.1         3.5          1.4         0.2 1        FALSE
#>  2          4.9         3            1.4         0.2 1        FALSE
#>  3          4.7         3.2          1.3         0.2 1        FALSE
#>  4          4.6         3.1          1.5         0.2 1        FALSE
#>  5          5           3.6          1.4         0.2 1        FALSE
#>  6          5.4         3.9          1.7         0.4 1        FALSE
#>  7          4.6         3.4          1.4         0.3 1        FALSE
#>  8          5           3.4          1.5         0.2 1        FALSE
#>  9          4.4         2.9          1.4         0.2 1        FALSE
#> 10          4.9         3.1          1.5         0.1 1        FALSE
#> # ℹ 140 more rows
Visualize the clustering with ggplot2.
augment(db, x) %>%
  ggplot(aes(x = Petal.Length, y = Petal.Width)) +
  geom_point(aes(color = .cluster, shape = noise)) +
  scale_shape_manual(values = c(19, 4))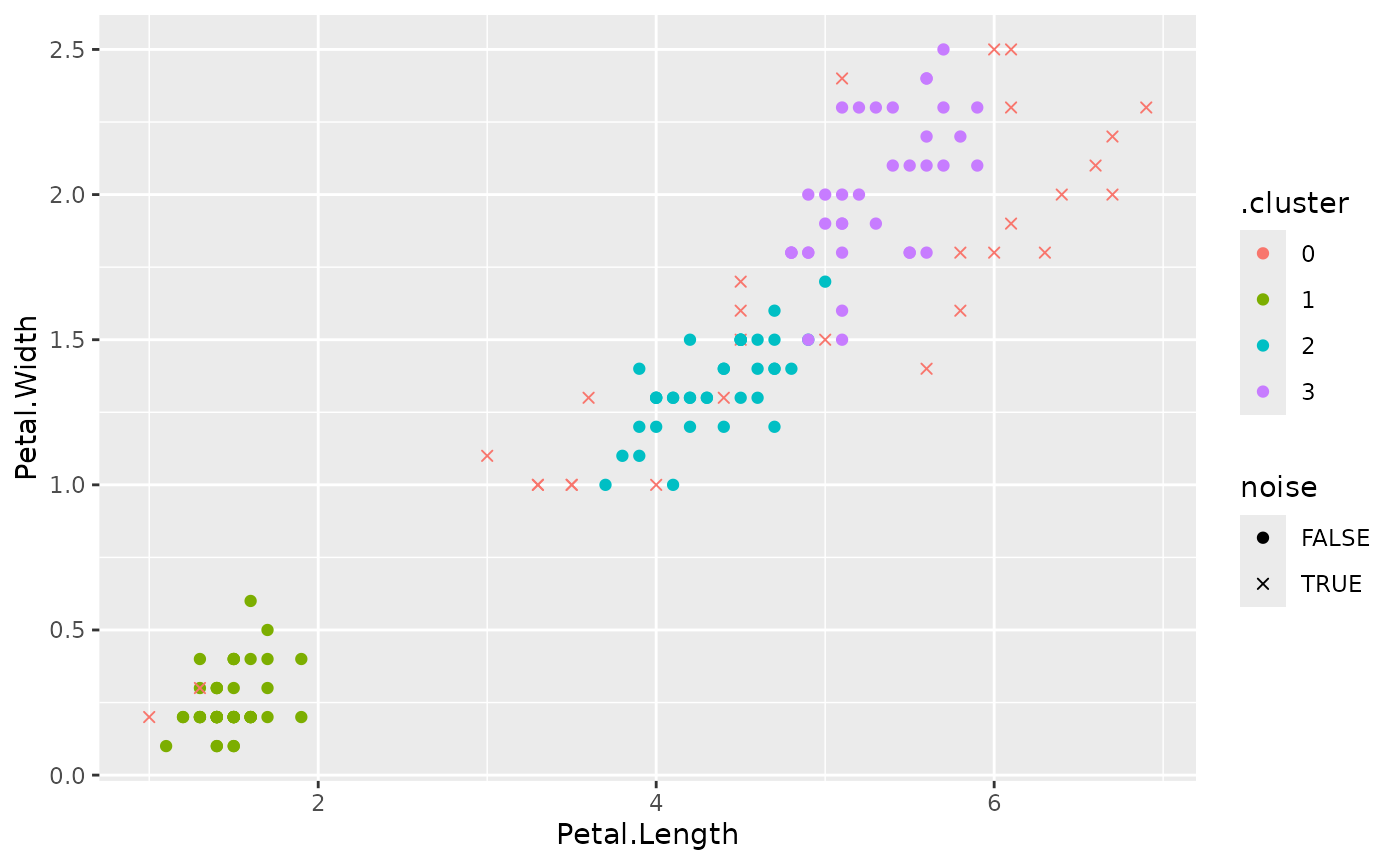
scale_shape_manual() sets the point symbols to filled
circles for regular points and x for noise points.