
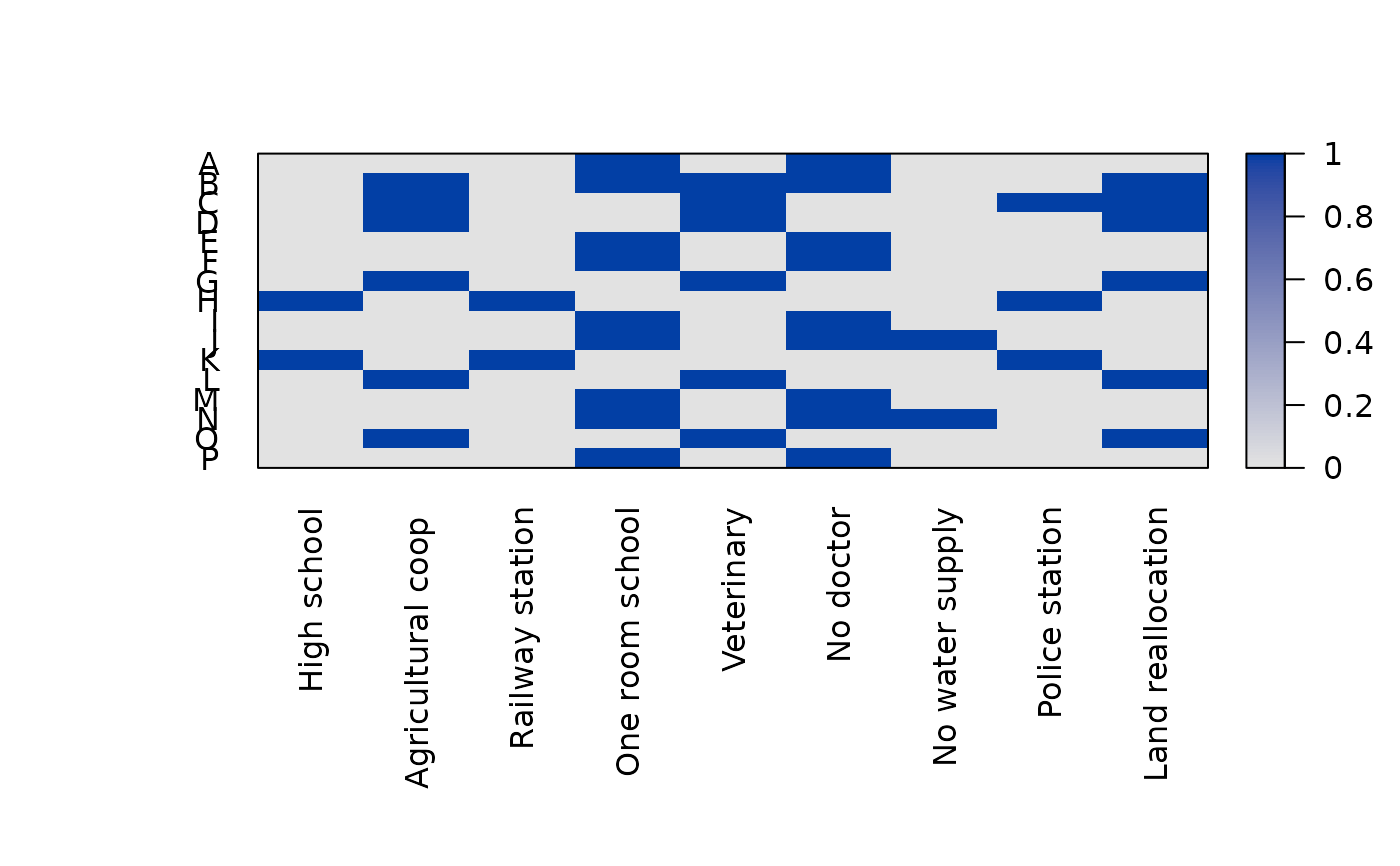
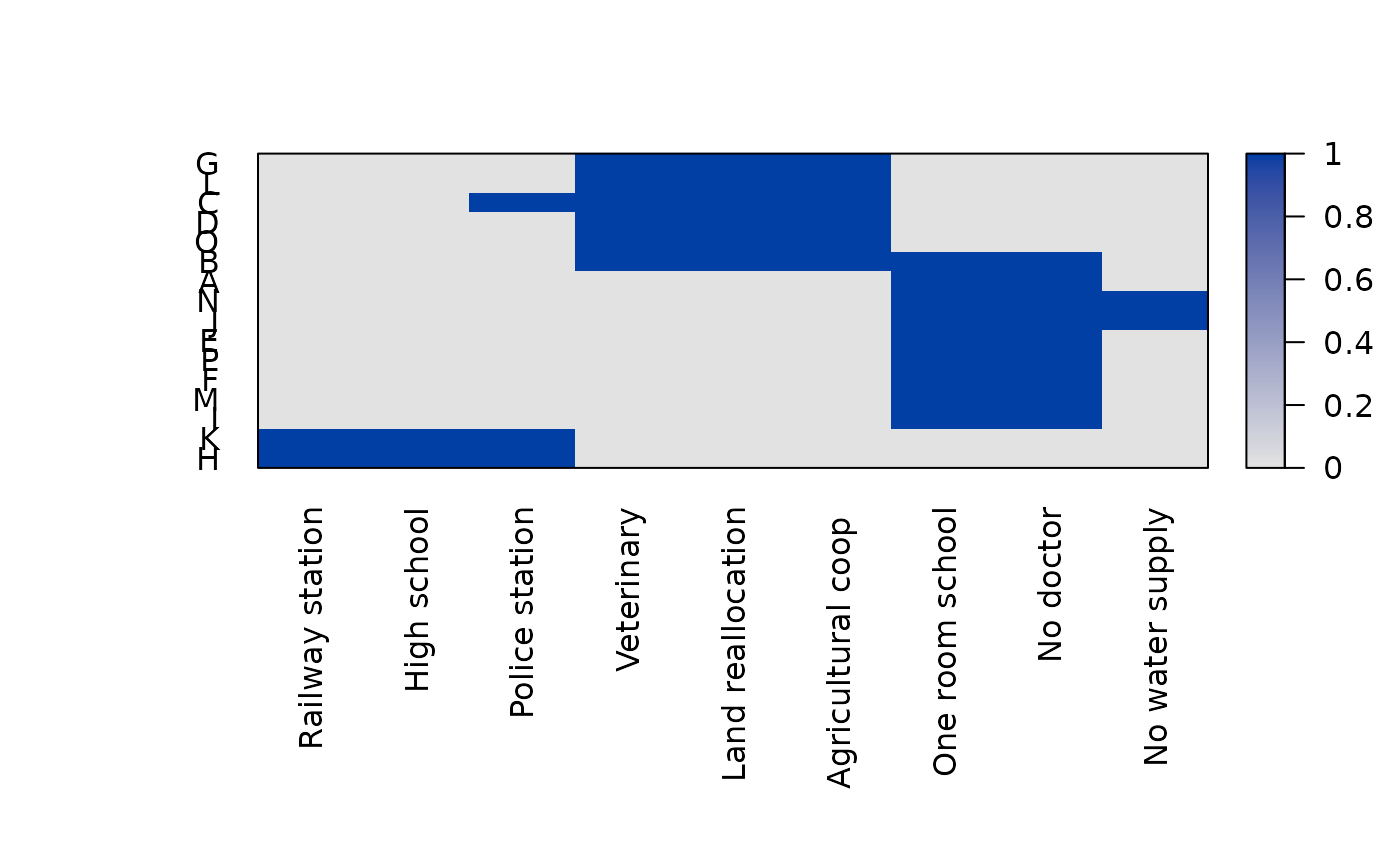
This data contains nine characteristics for 16 townships. The data set was used by Bertin (1981) to illustrate that the conciseness of presentation can be improved by seriating the rows and columns.
Format
A matrix with 16 0-1 variables (columns) indicating the presence
(1) or absence (0) of characteristics of townships
(rows).
References
Bertin, J. (1981): Graphics and Graphic Information Processing. Berlin, Walter de Gruyter.
See also
Other data:
Chameleon,
Irish,
Munsingen,
Psych24,
SupremeCourt,
Wood,
Zoo,
create_lines_data(),
is.robinson()
Examples
data("Townships")
## original data
pimage(Townships)
 criterion(Townships)
#> Cor_R ME Moore_stress Neumann_stress
#> -0.02834833 19.00000000 464.00000000 260.00000000
## seriated data using an improved Bond-Energy Algorithm
order <- seriate(Townships, method = "BEA_TSP")
pimage(Townships, order)
criterion(Townships)
#> Cor_R ME Moore_stress Neumann_stress
#> -0.02834833 19.00000000 464.00000000 260.00000000
## seriated data using an improved Bond-Energy Algorithm
order <- seriate(Townships, method = "BEA_TSP")
pimage(Townships, order)
 criterion(Townships, order)
#> Cor_R ME Moore_stress Neumann_stress
#> -0.06379438 64.00000000 214.00000000 84.00000000
criterion(Townships, order)
#> Cor_R ME Moore_stress Neumann_stress
#> -0.06379438 64.00000000 214.00000000 84.00000000