Data Stream Generator for Bars and Gaussians
Source:R/DSD_BarsAndGaussians.R
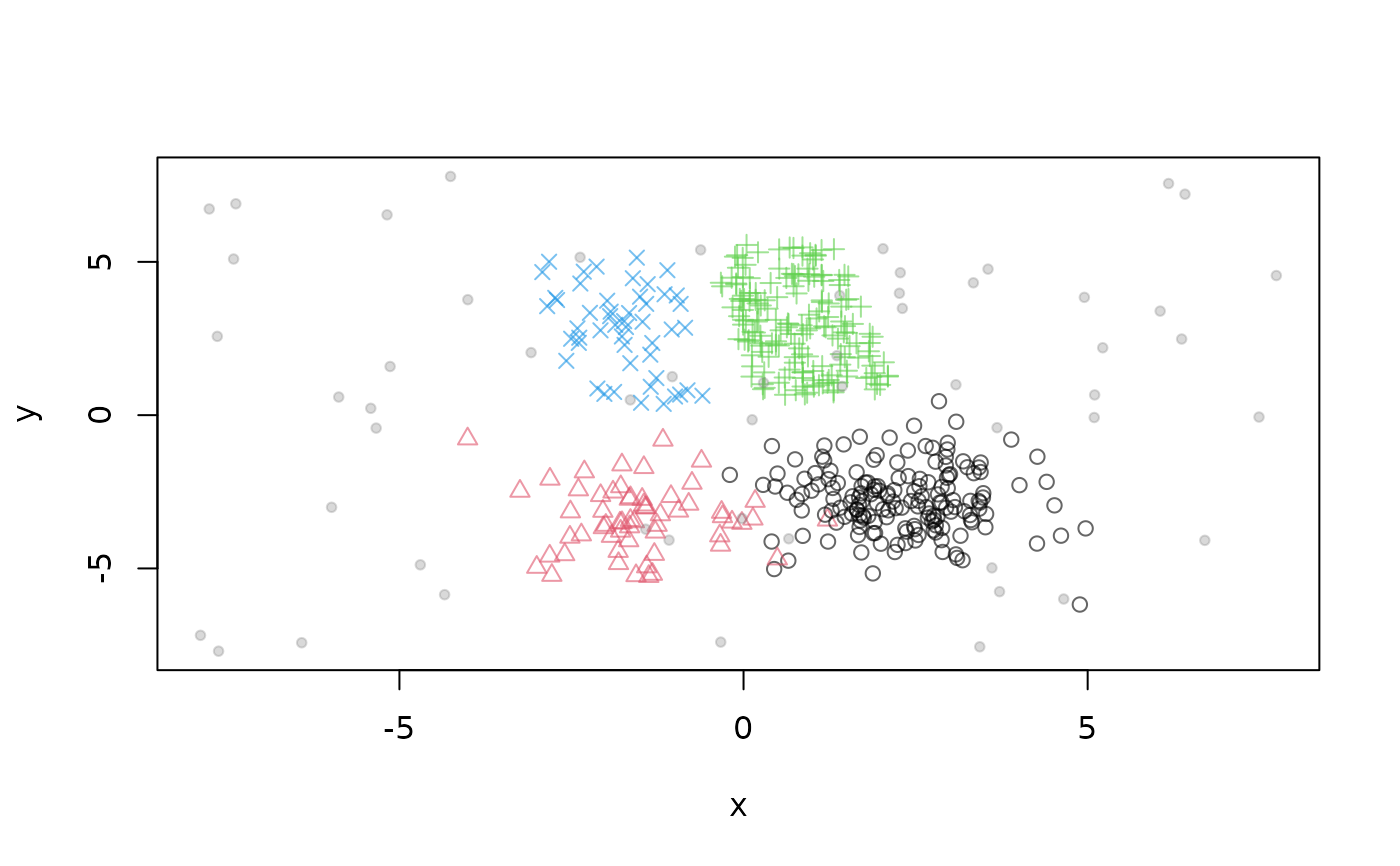
DSD_BarsAndGaussians.RdA data stream generator which creates the shape of two bars and two Gaussians clusters with different density.
See also
Other DSD:
DSD(),
DSD_Benchmark(),
DSD_Cubes(),
DSD_Gaussians(),
DSD_MG(),
DSD_Memory(),
DSD_Mixture(),
DSD_NULL(),
DSD_ReadDB(),
DSD_ReadStream(),
DSD_Target(),
DSD_UniformNoise(),
DSD_mlbenchData(),
DSD_mlbenchGenerator(),
DSF(),
animate_data(),
close_stream(),
get_points(),
plot.DSD(),
reset_stream()
Examples
# create data stream with three clusters in 2D
stream <- DSD_BarsAndGaussians(noise = 0.1)

get_points(stream, n = 10)
#>              x         y .class
#> 1  -1.57680878  3.952047      4
#> 2   3.10325388 -4.787931      1
#> 3   2.95586698 -2.940560      1
#> 4   1.87920308  1.398521      3
#> 5   0.06656601  2.600465      3
#> 6  -0.75723004 -4.140459      2
#> 7   1.75054455 -1.853142      1
#> 8   0.71817119  2.600374      3
#> 9  -2.56848599  3.444262      4
#> 10 -1.15812960 -2.079070      2
plot(stream)