
Estimate the parameters for the global negative binomial independence model used by NBMiner.
Usage
NBMinerParameters(
  data,
  trim = 0.01,
  pi = 0.99,
  theta = 0.5,
  bins = 10,
  minlen = 1,
  maxlen = 5,
  rules = FALSE,
  plot = TRUE,
  verbose = TRUE,
  getdata = FALSE
)
Arguments
- data
the data as an object of class
arules::transactions.- trim
fraction of the most frequent items to exclude when fitting the baseline model.
- pi
minimum predicted precision required to accept an itemset extension or rule.
- theta
fraction of an itemset's immediate subsets that must be NB-frequent for the itemset to be considered during search.
- bins
number of bins used for the chi-squared goodness-of-fit test.
- minlen
minimum number of items in returned itemsets (default: 1).
- maxlen
maximum number of items in returned itemsets (default: 5).
- rules
whether to mine NB-precise rules instead of NB-frequent itemsets.
- plot
whether to plot the observed and fitted frequency distributions.
- verbose
whether to print progress and goodness-of-fit results.
- getdata
whether to return the parameter object together with observed counts, expected counts, and the chi-squared test result.
Value
An object of class NBMinerParameter for use with NBMiner(). If
getdata = TRUE, a list containing the parameter object, observed counts,
expected counts, and the result of the chi-squared test is returned.
Details
The model is fit using observed item frequencies in the data. The expectation maximization (EM) algorithm (Dempster et al, 1977) is used to estimate the global NB model because the zero class (missing values representing items that do not occur in the dataset) is not observed. This procedure iteratively estimates missing values using the observed data and the model using intermediate values of the parameters, and then uses the estimated data and the observed data to update the parameters for the next iteration. The procedure stops when the parameters stabilize.
Another common issue is the presence of outliers with unusually high frequencies.
These outliers will distort the mean and the variance and thus will lead
to a model that grossly overestimates the probability of seeing items with
high frequencies. For a more robust estimate, we can trim a
suitable percentage of the items with the highest frequencies.
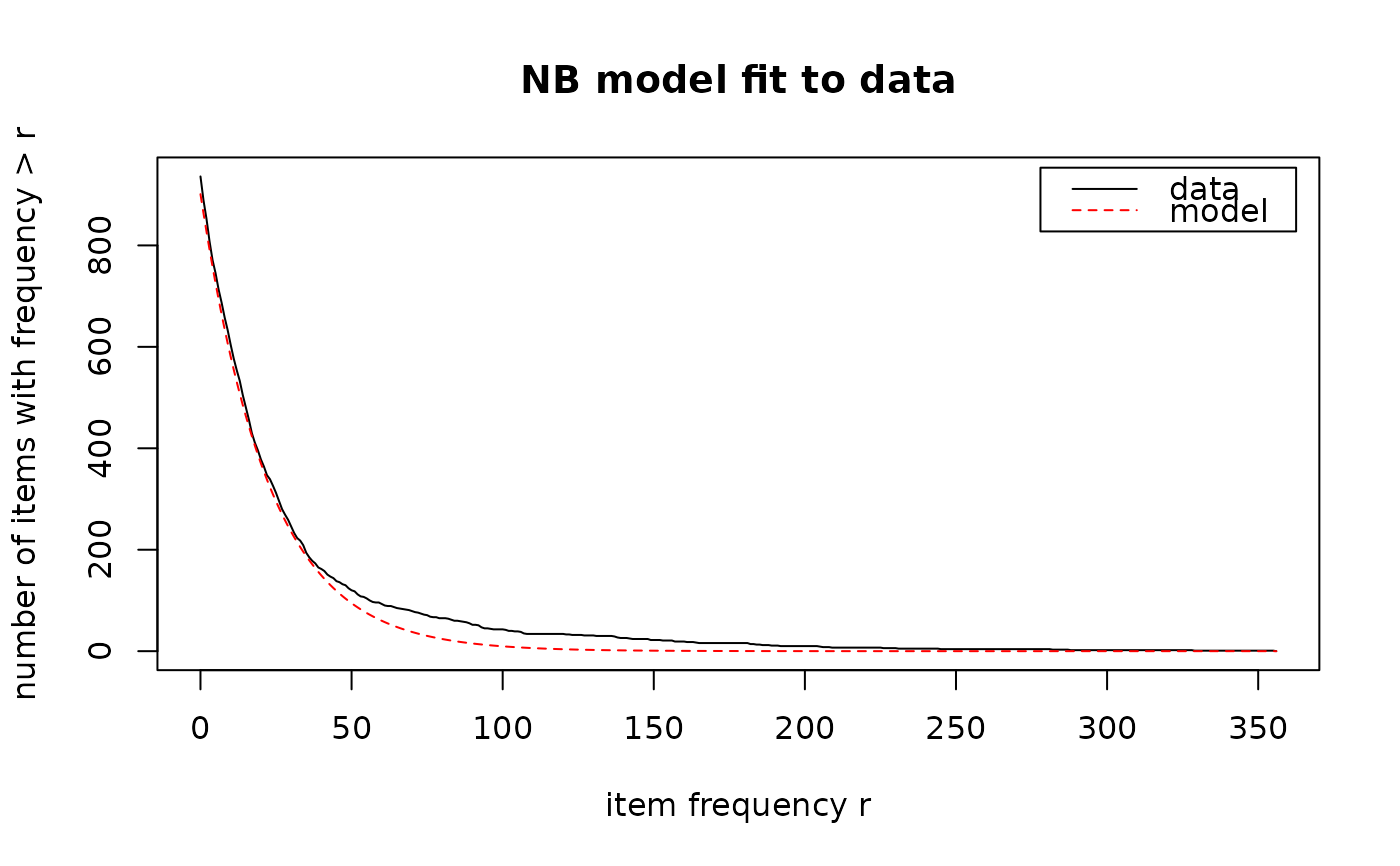
A suitable percentage can be found by visual comparison of the empirical
data and the estimated model or by minimizing the
\(\chi^2\)-value of the goodness-of-fit test which is
reported when run with verbose = TRUE. A diagnostic plot
comparing the observed data with the model is shown with plot = TRUE.
The plot shows the number of items with a frequency larger than \(r\).
The result is the two NB parameters \(k\) and \(a\), but note that \(a\) is rescaled by dividing it by the number of incidences in the data, as required by NBMiner. The estimated total number of items \(n\) including the fitted number of unseen items (items with a frequency of 0) is also returned.
Only data and trim are used for the estimation. bins can be used to
change the number of bins used in the goodness-of-fit test. The other
parameters are stored in the parameter object for use by NBMiner().
References
Michael Hahsler. A model-based frequency constraint for mining associations from transaction data. Data Mining and Knowledge Discovery,13(2):137-166, September 2006. doi:10.1007/s10618-005-0026-2
Dempster, A. P., Laird, N. M., and Rubin, D. B. (1977). Maximum likelihood from incomplete data via the EM algorithm. Journal of the Royal Statistical Society, Series B (Methodological), 39:1–38. doi:10.1111/j.2517-6161.1977.tb01600.x
Examples
data("Epub")
Epub
#> transactions in sparse format with
#> 15729 transactions (rows) and
#> 936 items (columns)
param <- NBMinerParameters(Epub, trim = 0.04)
#> 38 item(s) trimmed, leaving 898 items.
#> using Expectation Maximization for missing zero class
#> iteration = 1 , zero class = 42 , k = 1.033353 , m = 20.40213
#> iteration = 2 , zero class = 41 , k = 1.035593 , m = 20.42386
#> iteration = 3 , zero class = 41 , k = 1.035593 , m = 20.42386
#> total items = 939
#>
#> Goodness of fit/chi-square test on binned count data
#> H0: Observed counts match the expected proportions.
#> Bins: 10
#> X-squared = 6.598895 with 9 degrees of freedom
#> p.value = 0.6788001
#>
 param
#> pi theta n k a minlen maxlen rules
#> 0.99 0.5 939 1.035593 0.0008168539 1 5 FALSE
param
#> pi theta n k a minlen maxlen rules
#> 0.99 0.5 939 1.035593 0.0008168539 1 5 FALSE