Provides image() methods to generate level plots to visually
inspect binary incidence matrices, i.e., objects based on
itemMatrix (e.g., transactions, tidLists, items in
itemsets or rhs/lhs in rules). These plots can be used to identify problems
in a data set (e.g., recording problems with some transactions containing
all items).
Usage
# S4 method for class 'itemMatrix'
image(x, xlab = "Items (Columns)", ylab = "Elements (Rows)", ...)

# S4 method for class 'transactions'
image(x, xlab = "Items (Columns)", ylab = "Transactions (Rows)", ...)

# S4 method for class 'tidLists'
image(x, xlab = "Transactions (Columns)", ylab = "Items/itemsets (Rows)", ...)
Arguments
- x
the object (itemMatrix, transactions or tidLists).
- xlab, ylab
labels for the plot.
- ...
further arguments passed on to
image()in package Matrix which in turn are passed on tolevelplot()in lattice.
See also
image() in package Matrix
Other itemMatrix and transactions functions:
abbreviate(),
c,
crossTable(),
duplicated(),
extract,
hierarchy,
inspect(),
is.superset(),
itemFrequency(),
itemFrequencyPlot(),
itemMatrix-class,
itemwiseSetOps,
match(),
merge(),
random.transactions(),
sample(),
sets,
size(),
supportingTransactions(),
tidLists-class,
transactions-class,
unique()
Examples
data("Epub")

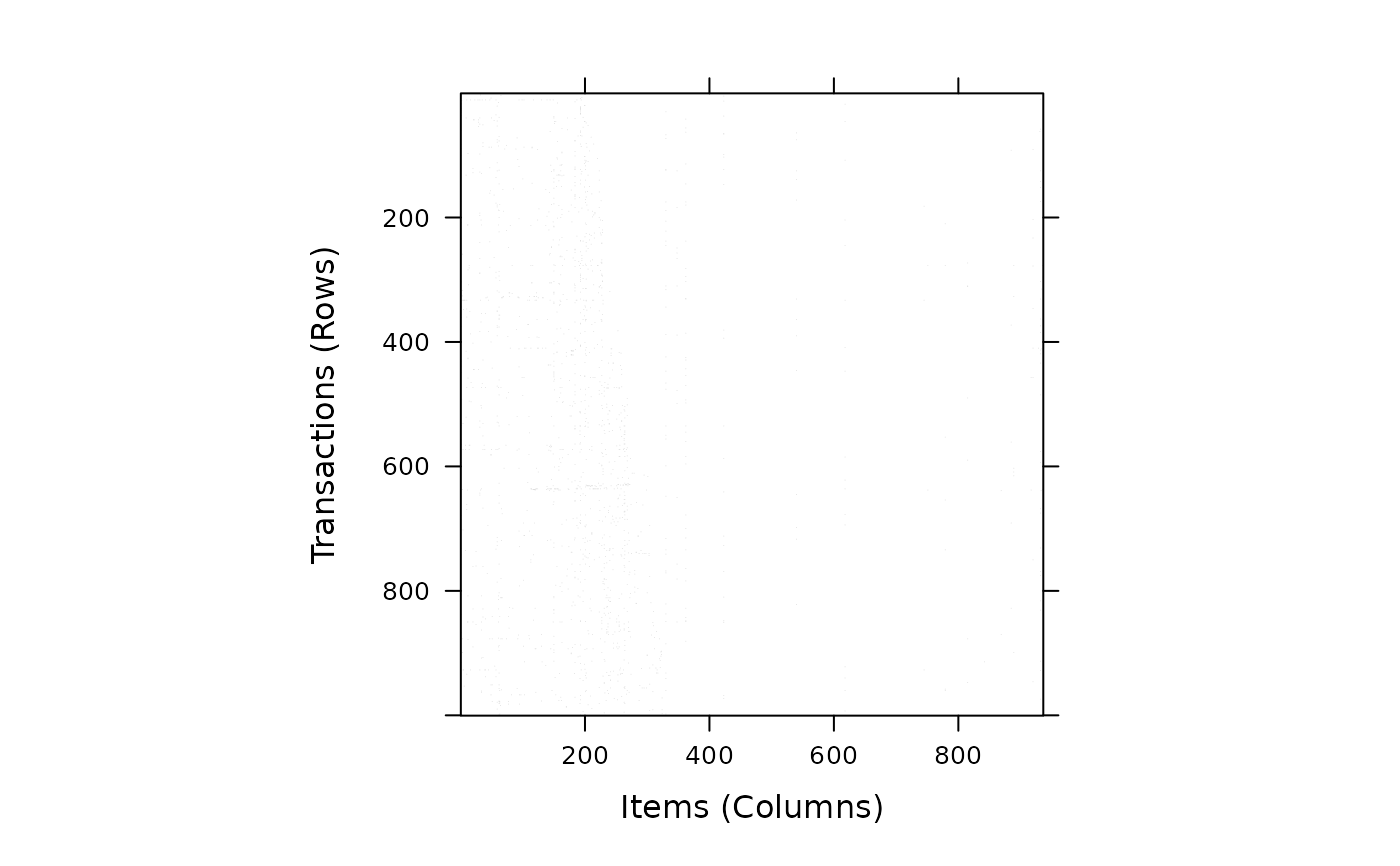
## in this data set we can see that not all
## items were available from the beginning.
image(Epub[1:1000])