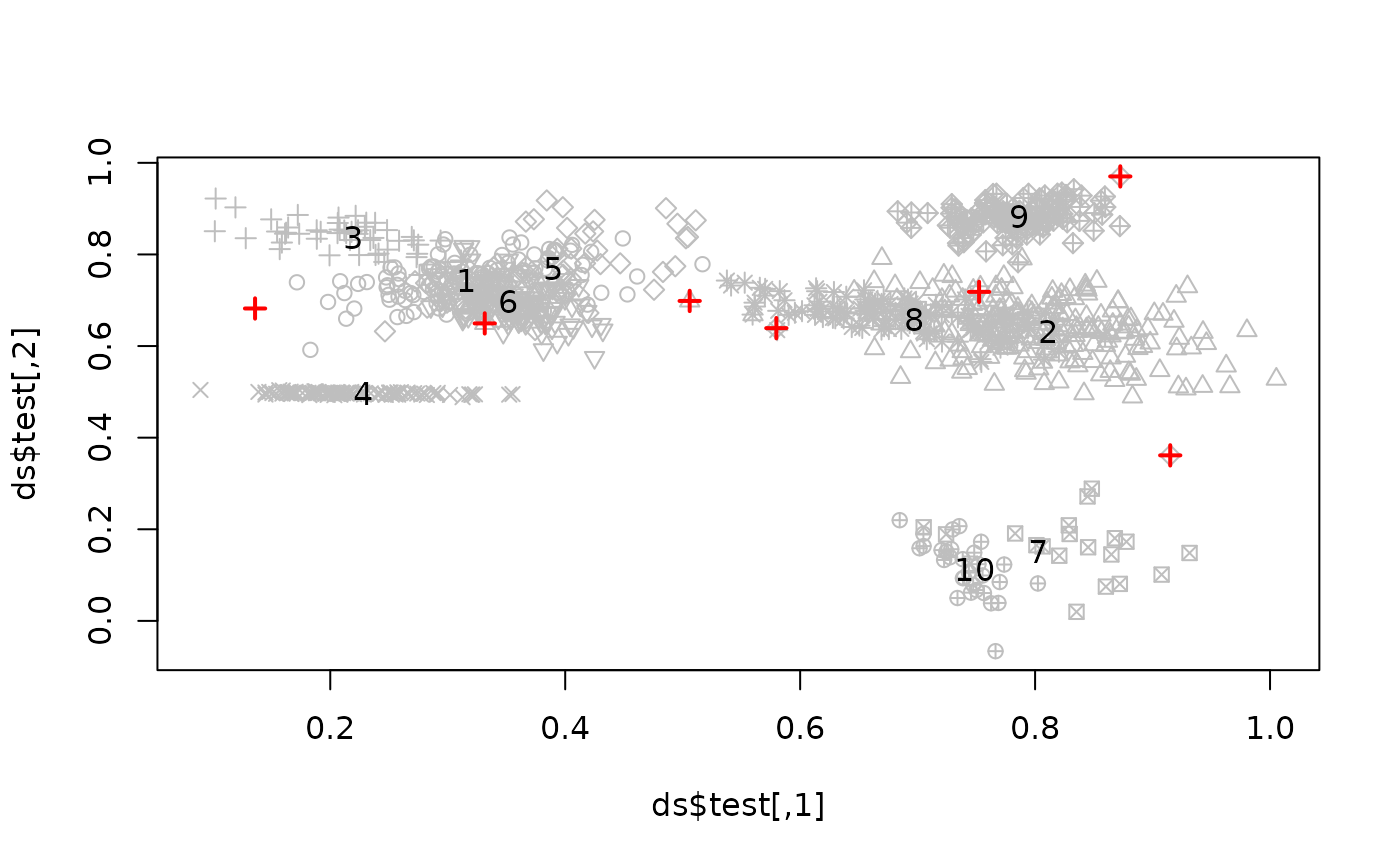
This function creates a synthetic data stream with data points in roughly \([0, 1]^p\) by choosing points form k clusters following a sequence through these clusters. Each cluster has a density function following a d-dimensional normal distributions. In the test set outliers are introduced.
Usage
synthetic_stream(
  k = 10,
  d = 2,
  n_subseq = 100,
  p_transition = 0.5,
  p_swap = 0,
  n_train = 5000,
  n_test = 1000,
  p_outlier = 0.01,
  rangeVar = c(0, 0.005)
)
Arguments
- k
number of clusters.
- d
dimensionality of data set.
- n_subseq
length of subsequence which will be repeat to create the data set.
- p_transition
probability that the next position in the subsequence will belong to a different cluster.
- p_swap
probability that two data points are swapped. This represents measurement errors (e.g., a data points arrive out of order) or that the data stream does not exactly follow the subsequence.
- n_train
size of training set (without outliers).
- n_test
size of test set (with outliers).
- p_outlier
probability that a data point is replaced by an outlier (a randomly chosen point in \([0,1]^p\)).
- rangeVar
Used to create the random covariance matrices for the clusters. See
genPositiveDefMat()in clusterGeneration for details.
Value
A list with the following elements:
- test
test data.
- train
training data.
- sequence_test
sequence of the test data points through the clusters.
- sequence_train
sequence of the training data points through the clusters.
- swap_test
index where points are swapped.
- swap_train
index where points are swapped.
- outlier_position
logical vector for outliers in test data.
- model
centers and covariance matrices for the clusters.
Details
The data generation process creates a data set consisting of k
clusters in
roughly \([0,1]^d\). The data points for each cluster are be drawn from a
multivariate normal distribution given a random mean and a random
variance/covariance matrix for each cluster. The temporal aspect is modeled by
a fixed subsequence (of length n_subseq) through the k
clusters. In each step in the subsequence we
have a transition probability p_transition that the next data point
is in the same
cluster or in a randomly chosen other cluster, thus we can create slowly or
fast changing data. For the complete sequence, the subsequence is repeated
to create n_test/n_train data points.
The data set is generated by drawing a data point from
the cluster corresponding to each position in the sequence. Outliers are
introduced by replacing data points in the data set with probability
$p_outlier by
randomly chosen data points in \([0,1]^d\).
Finally, to introduce imperfection
in the temporal sequence (e.g., because the data does not follow exactly a
repeating sequence or because observations do not arrive in the correct order),
we swap two consecutive observations with probability p_swap.