
Introduction
Standard clustering methods such as k-means group observations by
similarity, but do not model the order in which observations occurred.
TRAC() adds a Markov model of transitions between the
resulting clusters. The observations must be in sequence order: their
row order determines which cluster transitions are recorded.
Cluster the observations
The bundled EMMsim_train data are an ordered sequence of
two-dimensional observations. First, apply an ordinary k-means
clustering. K-means finds the clusters without using the sequence
order.
library(rEMM)
data("EMMsim")

set.seed(1234)
cl <- kmeans(EMMsim_train, centers = 10)
cl
#> K-means clustering with 10 clusters of sizes 10, 18, 22, 20, 10, 11, 20, 20, 40, 29
#>
#> Cluster means:
#>              x           y
#> 1  -0.33786688 -0.04818666
#> 2   0.90991915  0.17276634
#> 3   0.89307984  0.22373658
#> 4   0.14800621  0.08396181
#> 5   0.33696494 -0.05514731
#> 6   0.01052130  0.66033766
#> 7  -0.01758605 -0.08171103
#> 8  -0.07238177  0.07141279
#> 9   0.99961897  1.00477281
#> 10  0.28847523  0.71704514
#>
#> Clustering vector:
#>   [1]  1  6  4  9  2  7 10  4  9  2  7 10  7  9  3  5 10  1  9  2  5 10  1  9  2
#>  [26]  1 10  8  9  3  4 10  8  9  3  7 10  5  9  3  7 10  4  9  2  8  6  8  9  3
#>  [51]  7 10  8  9  3  7 10  8  9  3  7  6  5  9  2  4 10  1  9  3  8  6  4  9  3
#>  [76]  8  6  8  9  2  8 10  4  9  2  5 10  5  9  3  1  6  4  9  3  7 10  5  9  3
#> [101]  4 10  4  9  3  7  6  8  9  2  4  6  7  9  2  7 10  7  9  3  8 10  4  9  3
#> [126]  4  6  1  9  3  4 10  7  9  3  8  6  5  9  3  8 10  8  9  2  4 10  4  9  3
#> [151]  7 10  7  9  2  5 10  8  9  2  7 10  7  9  3  4 10  7  9  2  8  6  8  9  2
#> [176]  1 10  1  9  2  4 10  8  9  2  7 10  8  9  3  1 10  4  9  2  5 10  4  9  3
#>
#> Within cluster sum of squares by cluster:
#>  [1] 0.18532866 0.01456895 0.01624117 0.18555847 0.15694746 0.09658868
#>  [7] 0.17139725 0.17097032 0.20458716 0.17402492
#>  (between_SS / total_SS =  98.2 %)
#>
#> Available components:
#>
#> [1] "cluster"      "centers"      "totss"        "withinss"     "tot.withinss"
#> [6] "betweenss"    "size"         "iter"         "ifault"
Add the temporal model
Pass the clustering result to TRAC(). It uses the
k-means centers and assignments to create an EMM, then processes the
assignments in their original order to learn transitions. The result
contains both the clusters and their temporal relationships.
emm <- TRAC(cl)
emm
#> EMM with 10 states/clusters.
#>  Measure: euclidean
#>  Threshold: 0.4084064
#>  Centroid: TRUE
#>  Lambda: 0
The transition graph can be visualized alongside a two-dimensional layout of the cluster centers:
plot(emm, method = "MDS")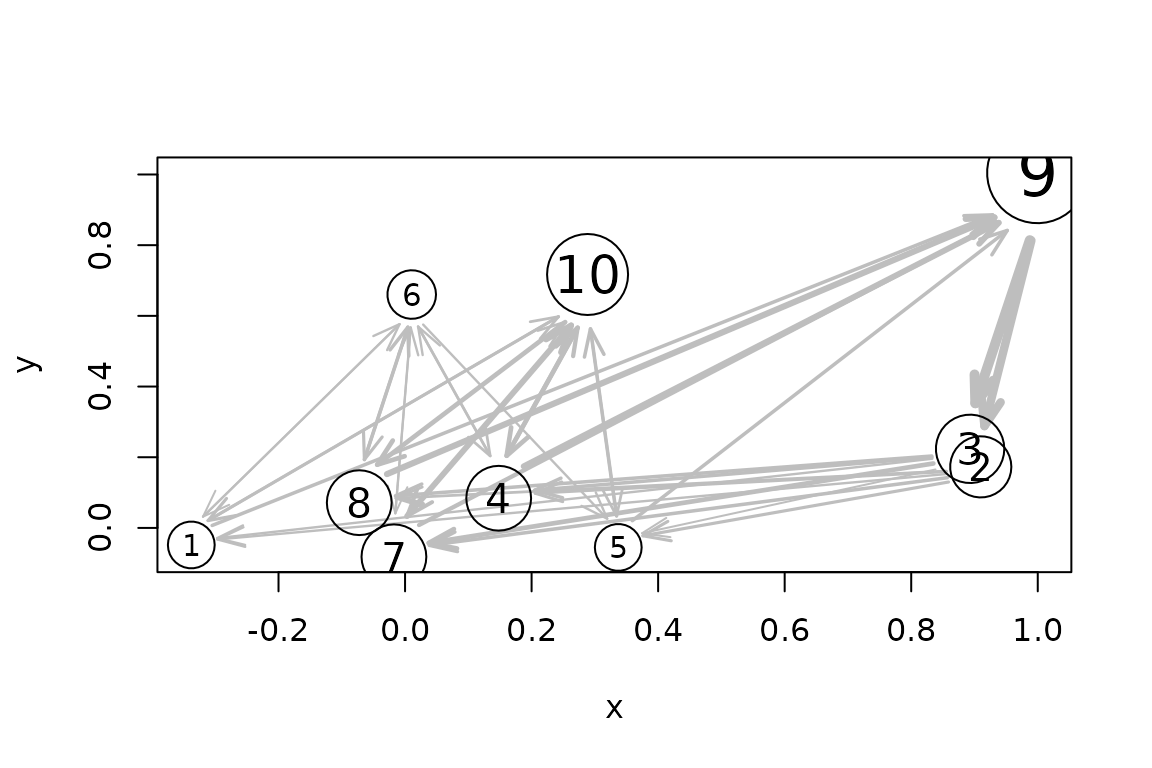
Clusters and learned transitions from the ordered sequence.
If a different clustering algorithm is used that does not produce a
standard clustering object, then TRAC() also accepts a
vector of cluster assignments. In that case, provide the data used for
clustering so it can calculate cluster centers and distance
thresholds:
emm_from_labels <- TRAC(cl$cluster, data = EMMsim_train)
emm_from_labels
#> EMM with 10 states/clusters.
#>  Measure: euclidean
#>  Threshold: 0.284998
#>  Centroid: TRUE
#>  Lambda: 0
The assignments must correspond to the rows of the data in sequence order; otherwise, the learned transitions will not represent the original sequence. The result is the same model as before when the clustering object was used.