Implements a sliding window data stream operator which keeps a fixed amount (window length) of the most recent data points of the stream.
Value
An object of class DSAggregate_Window (subclass of DSAggregate).
Details
If lambda is greater than 0 then the weight uses a damped window
model (Zhu and Shasha, 2002). The weight for points in the window follows
\(2^(-lambda*t)\) where \(t\) is the age of the point.
References
Zhu, Y. and Shasha, D. (2002). StatStream: Statistical Monitoring of Thousands of Data Streams in Real Time, Intl. Conference of Very Large Data Bases (VLDB'02).
See also
Other DSAggregate:
DSAggregate(),
DSAggregate_Sample()
Examples
set.seed(1500)

## Example 1: Basic use
stream <- DSD_Gaussians(k = 3, d = 2, noise = 0.05)

window <- DSAggregate_Window(horizon = 10)
window
#> Sliding windowClass: DSAggregate_Window, DSAggregate, DST

# update with only two points. The window is mostly empty (NA)
update(window, stream, 2)
get_points(window)
#>           X1        X2 .class
#> 3         NA        NA     NA
#> 4         NA        NA     NA
#> 5         NA        NA     NA
#> 6         NA        NA     NA
#> 7         NA        NA     NA
#> 8         NA        NA     NA
#> 9         NA        NA     NA
#> 10        NA        NA     NA
#> 1  0.8762547 0.5229369      2
#> 2  0.8124275 0.2624523      1

# get weights and window as a single data.frame
get_model(window)
#>    weight        X1        X2 .class
#> 3       1        NA        NA     NA
#> 4       1        NA        NA     NA
#> 5       1        NA        NA     NA
#> 6       1        NA        NA     NA
#> 7       1        NA        NA     NA
#> 8       1        NA        NA     NA
#> 9       1        NA        NA     NA
#> 10      1        NA        NA     NA
#> 1       1 0.8762547 0.5229369      2
#> 2       1 0.8124275 0.2624523      1

# update window
update(window, stream, 100)
get_points(window)
#>           X1        X2 .class
#> 3  0.4261088 0.2965189      3
#> 4  0.7784012 0.2364471      1
#> 5  0.9029506 0.5557783      2
#> 6  0.7720509 0.2656545      1
#> 7  0.8536844 0.6830931     NA
#> 8  0.9544277 0.4679511      2
#> 9  0.8106137 0.2341865      1
#> 10 0.4306247 0.1629674      3
#> 1  0.8833969 0.5530094      2
#> 2  0.7468827 0.2084139      1

## Example 2: Implement a classifier over a sliding window
window <- DSAggregate_Window(horizon = 100)

update(window, stream, 1000)

# train the classifier on the window
library(rpart)
tree <- rpart(`.class` ~ ., data = get_points(window))
tree
#> n=95 (5 observations deleted due to missingness)
#>
#> node), split, n, deviance, yval
#>       * denotes terminal node
#>
#> 1) root 95 58.98947 1.989474
#>   2) X1>=0.6217785 66 16.36364 1.545455
#>     4) X2< 0.3527057 30  0.00000 1.000000 *
#>     5) X2>=0.3527057 36  0.00000 2.000000 *
#>   3) X1< 0.6217785 29  0.00000 3.000000 *

# predict the class for new points from the stream
new_points <- get_points(stream, n = 100, info = FALSE)
pred <- predict(tree, new_points)
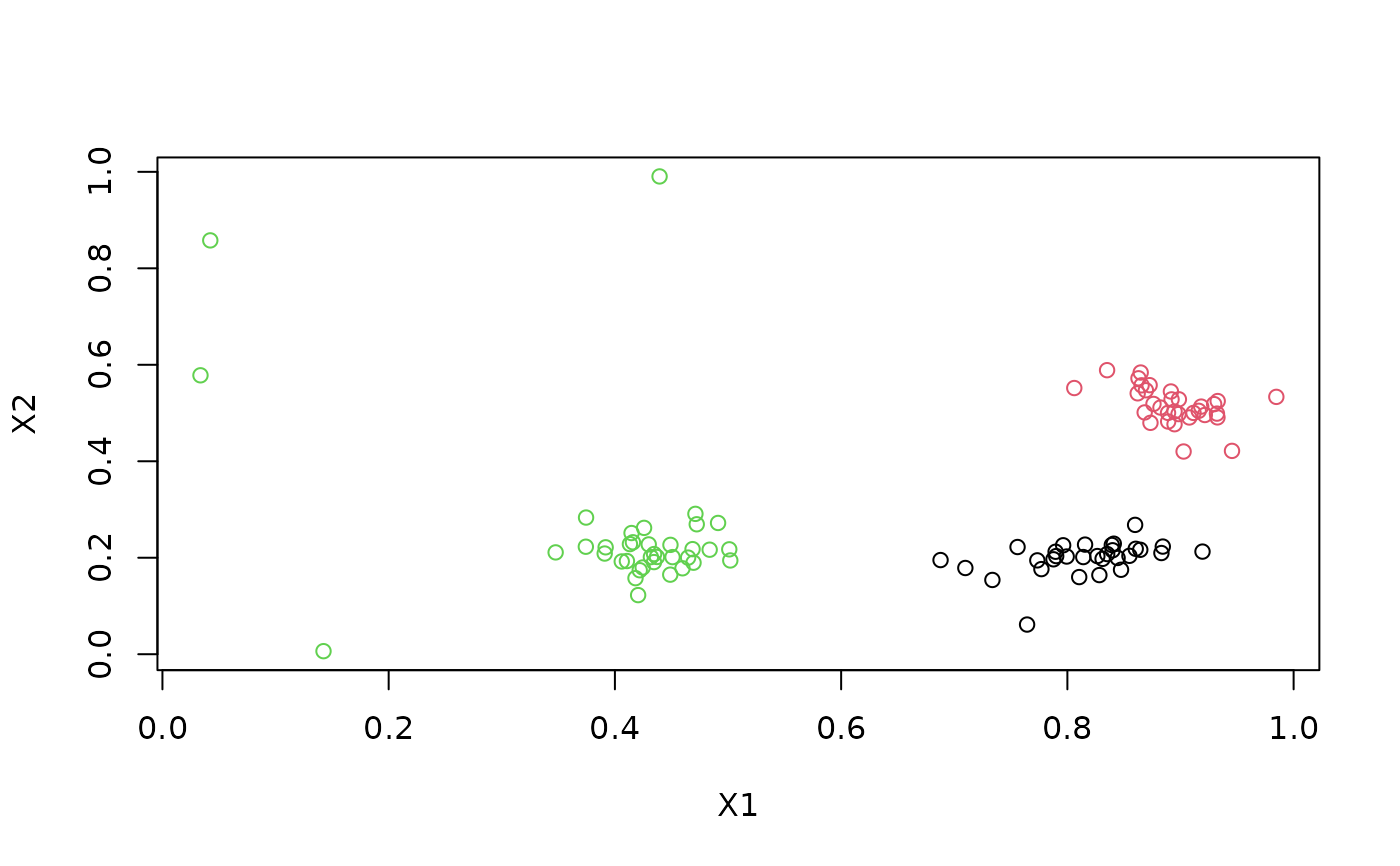
plot(new_points, col = pred)